This project focused on the development and evaluation of a B2B Web based application embedding an ML model that would produce data on the probability of lawsuits for power companies based on features such as: number of complaints, electrical damage to appliances and power shutdowns. Here, I focused on the UX design and evaluation considering the needs of end users and proposing reports that would meet their expectations.
Keywords User Story Interviews Information Architecture Wireframing Prototyping
Design Patterns Functional Testing User Testing Figma Data Visualization
Team Applied Computing Group (ACG)
Role UX/UI Lead Designer
Location Brazil – Remote
Timeline November 2018 – July 2019
In Brazil, the need for changes in the market for electric energy companies has become more evident in recent years, mainly due to the appearance of lawsuits against such companies. Customers file lawsuits when they are displeased with the treatment and/or service provided by a company and want to be treated fairly. Identifying customers who are likely to file a lawsuit against the company is considered an identification of customer dissatisfaction.
Problem: Although many works propose ways to treat customers and predict possible actions or churn customers, which may leave the company or even file lawsuits against it, they do not provide a tool for an individual or joint customer analysis. A joint relationship of customer groups needs exploration since features of customer groups in certain regions can be crucial in deciding lawsuits, especially when it comes to key services such as electric power services.
Solution: An ML system for energy companies to predict lawsuits related to unregistered consumption and power outage was requested as a deliverable by a power company.
Methodology
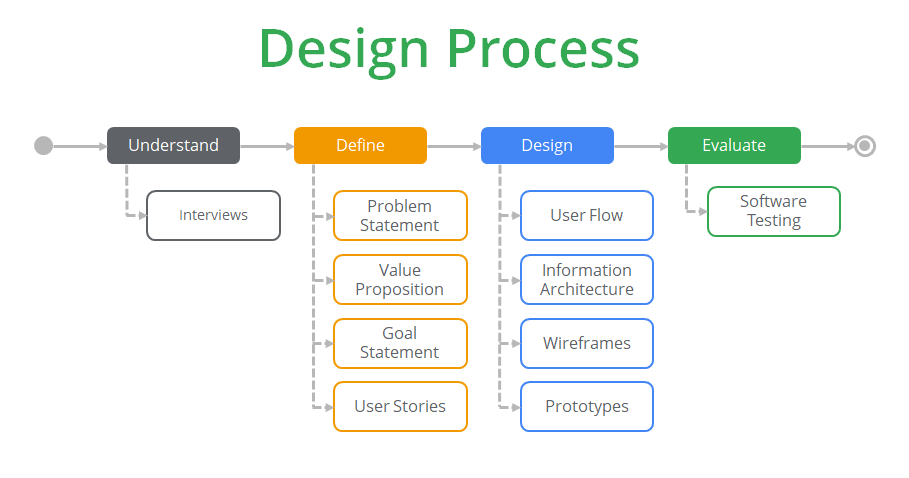
The design process was shortened due to time constrains and considered some activities within four main stages: understand, define, design and evaluate. This process was based on the user centered design process and aimed at meeting the needs of end users within the [omitted] company. During the understand phase, user research was carried out, while understanding the problem domain and the types of users. During the define phase, we organized the obtained data and characterized the project in terms of problem and goals. Then, we produced prototypes during the design phase. Finally, we evaluated our proposal through user testing.
Execution and Results
(UNDERSTAND)
01
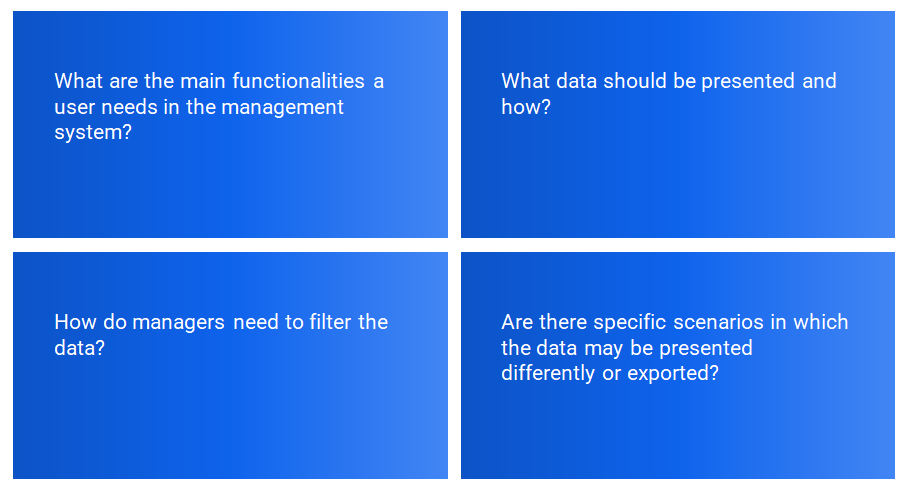
We carried out semi-structured interviews to gather data regarding what type of reports the machine learning system would provide. We asked end-users who provided feedback and directors to validate the data that was needed in by the higher managers within the organization.
(DEFINE)
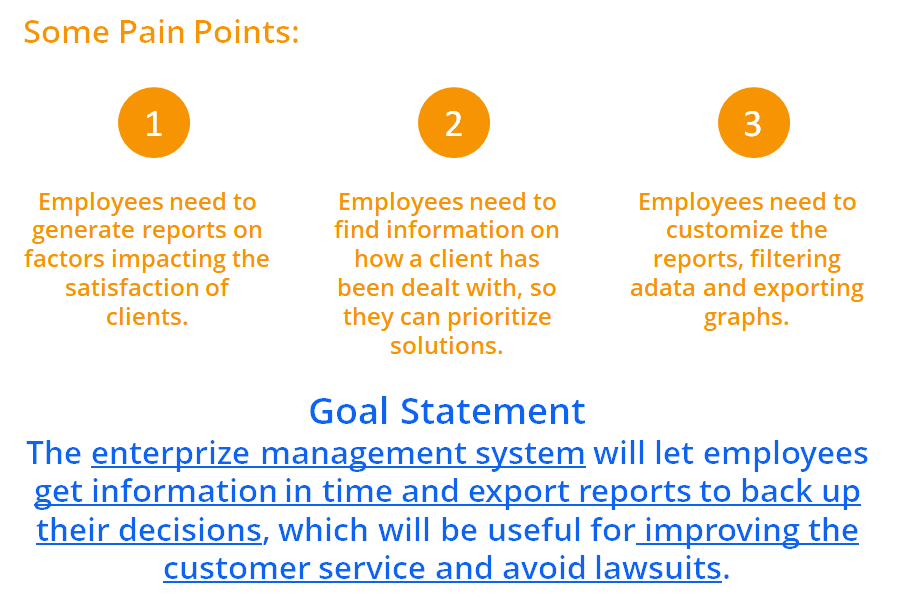
02A
The goal to produce an ML system in the field of consumer relationship for analyzing the degree to which a client could file lawsuits against a power company.
(DEFINE)
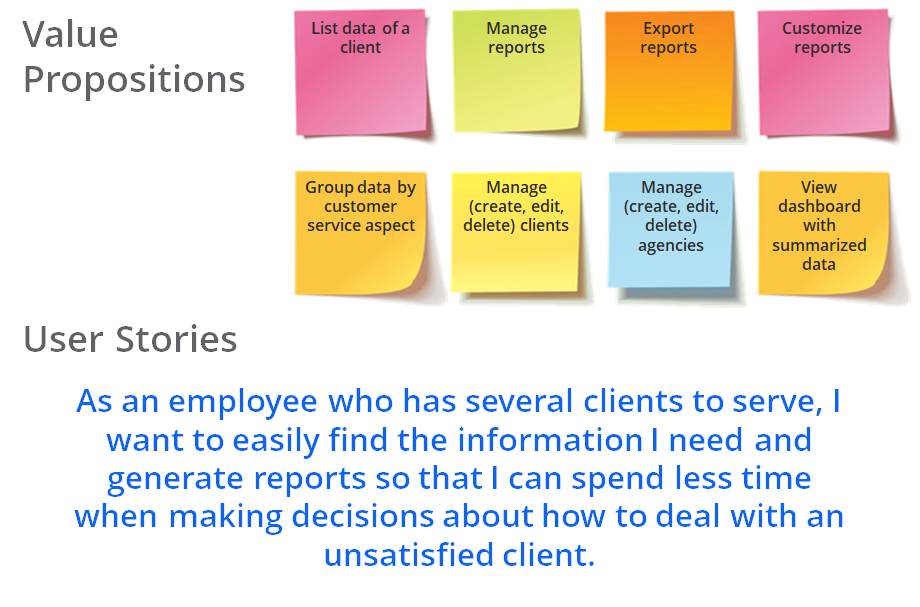
02B
Value propositions summarize why a consumer should use a product or service. We defined what the enterprise management system provides users and how it addresses users’ pain points.
Also, we defined user stories to make sure that we were addressing and solving the key problems our users might face when engaging with the enterprise management system.
(DESIGN)
03A
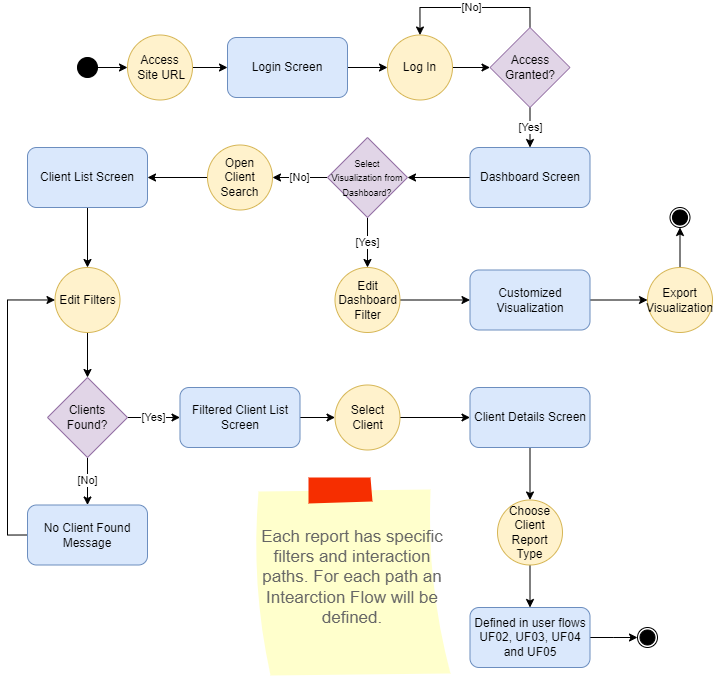
We proposed user flows using activity diagrams to display the complete path a user takes when using the product. The user flow lays out the user’s movement through the product, mapping out each and every step the user takes. We used these flows to guide the identification of screens and, later, the proposal of wireframes and prototypes.
The user flow presented in this page is related to the use of the dashboard (not detailed) and how an employee can start filtering clients and viewing specific reports for them.
(DESIGN)
03B
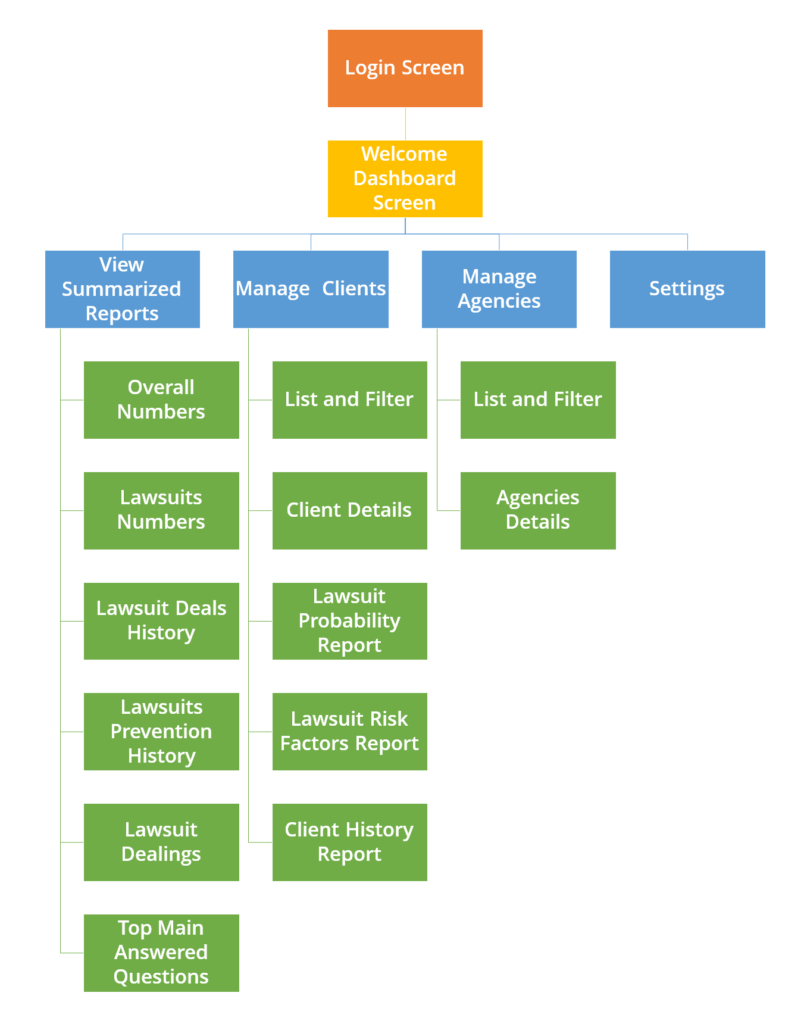
We proposed the information architecture for organizing, structuring, and labeling content in an effective way. Our goal was to help users find information and complete tasks.
The information architecture presented in this page displays pages and interactions of the Enterprise Management System from the point of view of an employee working on customer service.
(DESIGN)
03C
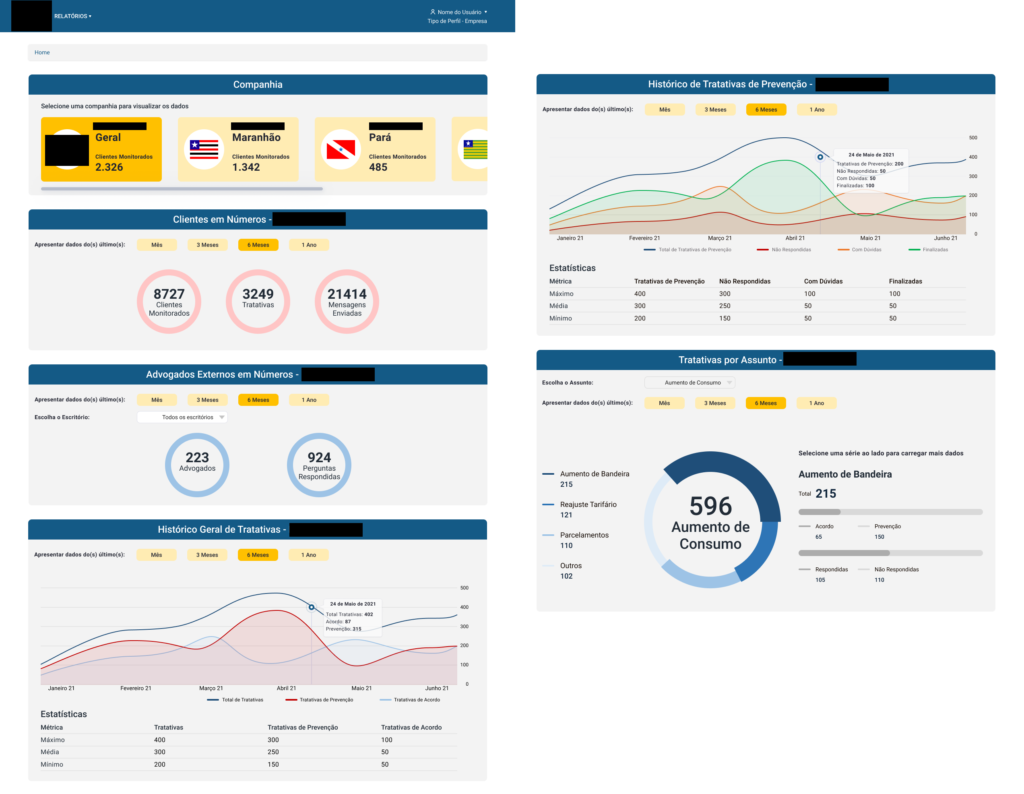
We designed wireframes and prototypes to show stakeholders and potential users what our design idea could do. Users interacted with the prototype and we refined the prototype to meet the users needs.
The prototype presented in this page shows parts of the dashboard in which some generic reports were presented. The prototype is in Portuguese and some parts have been blurred due to confidentiality reasons.
(EVALUATION)
04A
Since the design was approved, during validation meetings, the stakeholders were more interested in the correctness of the application. Thus, we evaluated the proposal using system testing, with the real data.
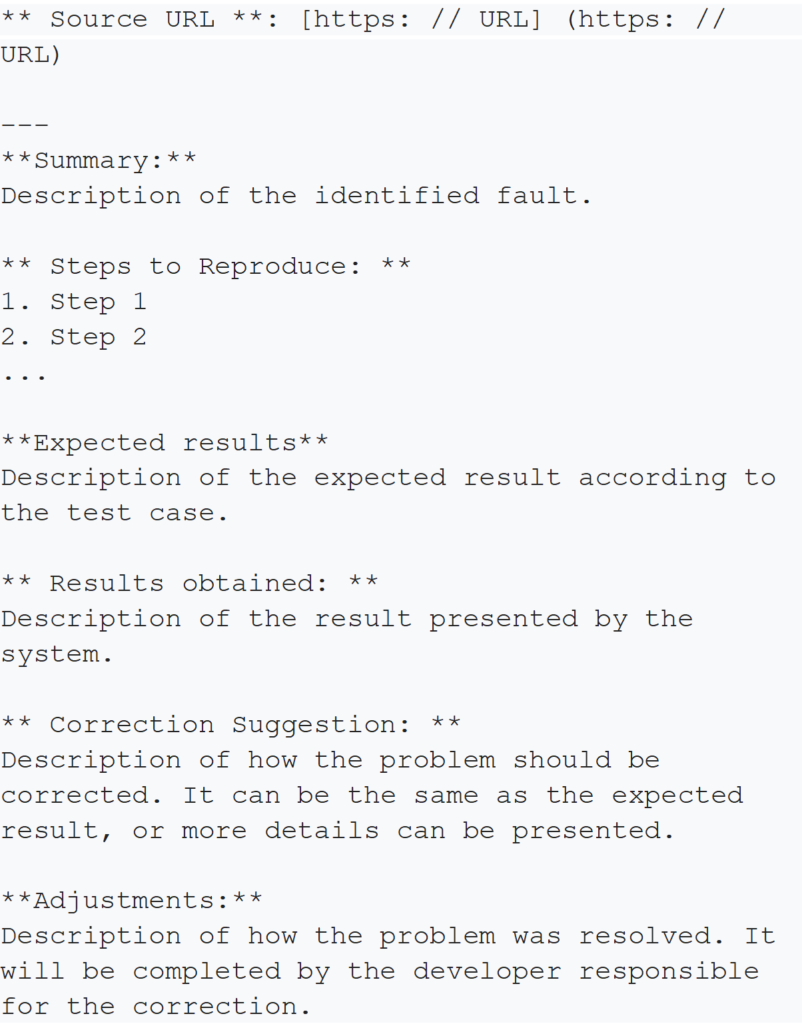
After defining the functionalities and test scenarios, the test team specified each scenario indicating the code, name of the scenario, summary, preconditions for executing the scenario, link to start the test interaction, set of steps in the scenario and expected results within these steps.
After identifying a problem, the development team adopted a report approach using Trello and a set of spreadsheets. We would indicate information such as: functionality id, tester name, problem description, team member that was responsible for the correction, degree of severity, date to correct the problem and an image of the problem. The report format is shown partially in this web page.
(EVALUATION)
04B
By the end of the project, 254 functional test scenarios were identified using exploratory testing. These test scenarios were distributed among the modules: configuration (72), tabular report (94) and map report (88). Through these tests, we verified the functionalities in terms of proper response of the system, adequate data presentation, system messages, input error handling and navigation. By the end of the project, all test cases passed and all light, serious and catastrophic problems were corrected, guaranteeing the proper functioning of the ML web system. Also, through ad-hoc inspections during the identification of the test scenarios, the test team identified problems regarding inconsistency between user interface elements, confusing and or missing messages, wrong layout configuration, and doubts caused by the interaction, which were useful for redesigning tasks within the Web application to increase ease of use.
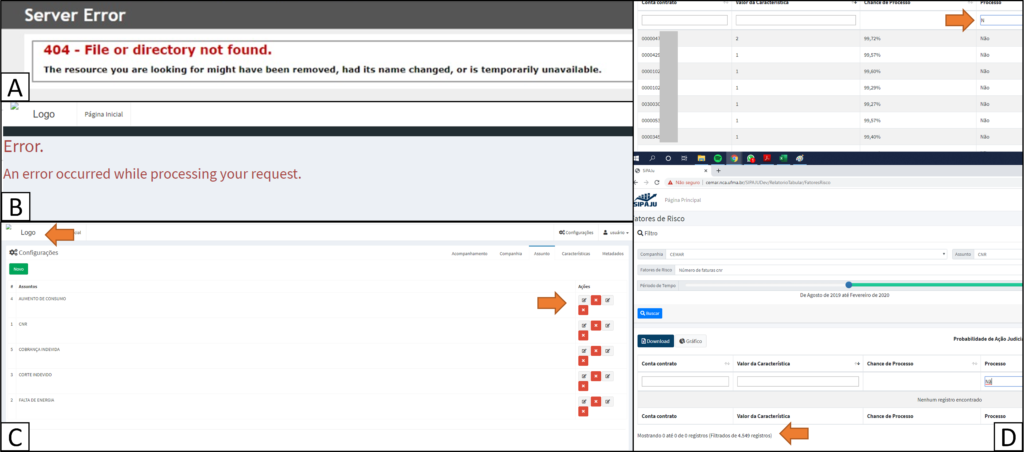
In this project overview, we show some of the identified problems that were corrected after applying the exploratory testing approach. Screenshots A and B present examples of navigation problems and wrong paths that were applied during the development of the application after updating old functionalities. Also, some problems regarding not referencing images were identified. For instance, in Screenshot C it is also possible to identify layout problems that were discovered by changing the zoom properties of the application in the browser. Finally, Screenshot D shows an example of a function for filtering data that was not working properly, as it did not filter special characters.
- The End -
We proposed an ML system capable of predicting clients with strong chances of filing lawsuits on unregistered consumption and power outages. By using manual testing, different types of bugs and problems were solved, while also suggesting improvement opportunities in the system prior to its deployment in the power plant managers’ work environment.
Both the company and the customers benefit from this system since once the company has predictive customer insights, it can act to improve customer relationships and customer satisfaction, as well as reduce litigation expenses. From the point of view of the Enterprise Management System, we managed to identify problems that if not corrected, could lead to catastrophic problems.